The PharmaSUG 2018 conference was held two weeks ago, with great enthusiasm and a record attendance. The highlight for me was the large spread on visual presentation of data, from papers to poster presentations. I will provide a more detailed report on all the exciting graphical presentations.
One topic of interest at this conference and in general is in presenting more information in a Waterfall chart. This idea was proposed in a paper in the Annals of Oncology. A paper for creating such a 3D graph using SAS was presented by Elizabeth Thomas. I too had previously written a blog on the topic of 3D Waterfall Chart recently in which I also proposed a simple 2D view of the same data.
Recently, I have tried to see if we could incorporate all the information in the original separate Waterfall and Swimmer Plots in one graph. Given the amount of information in the graph, this view is relatively simple to understand. The graph is included below.
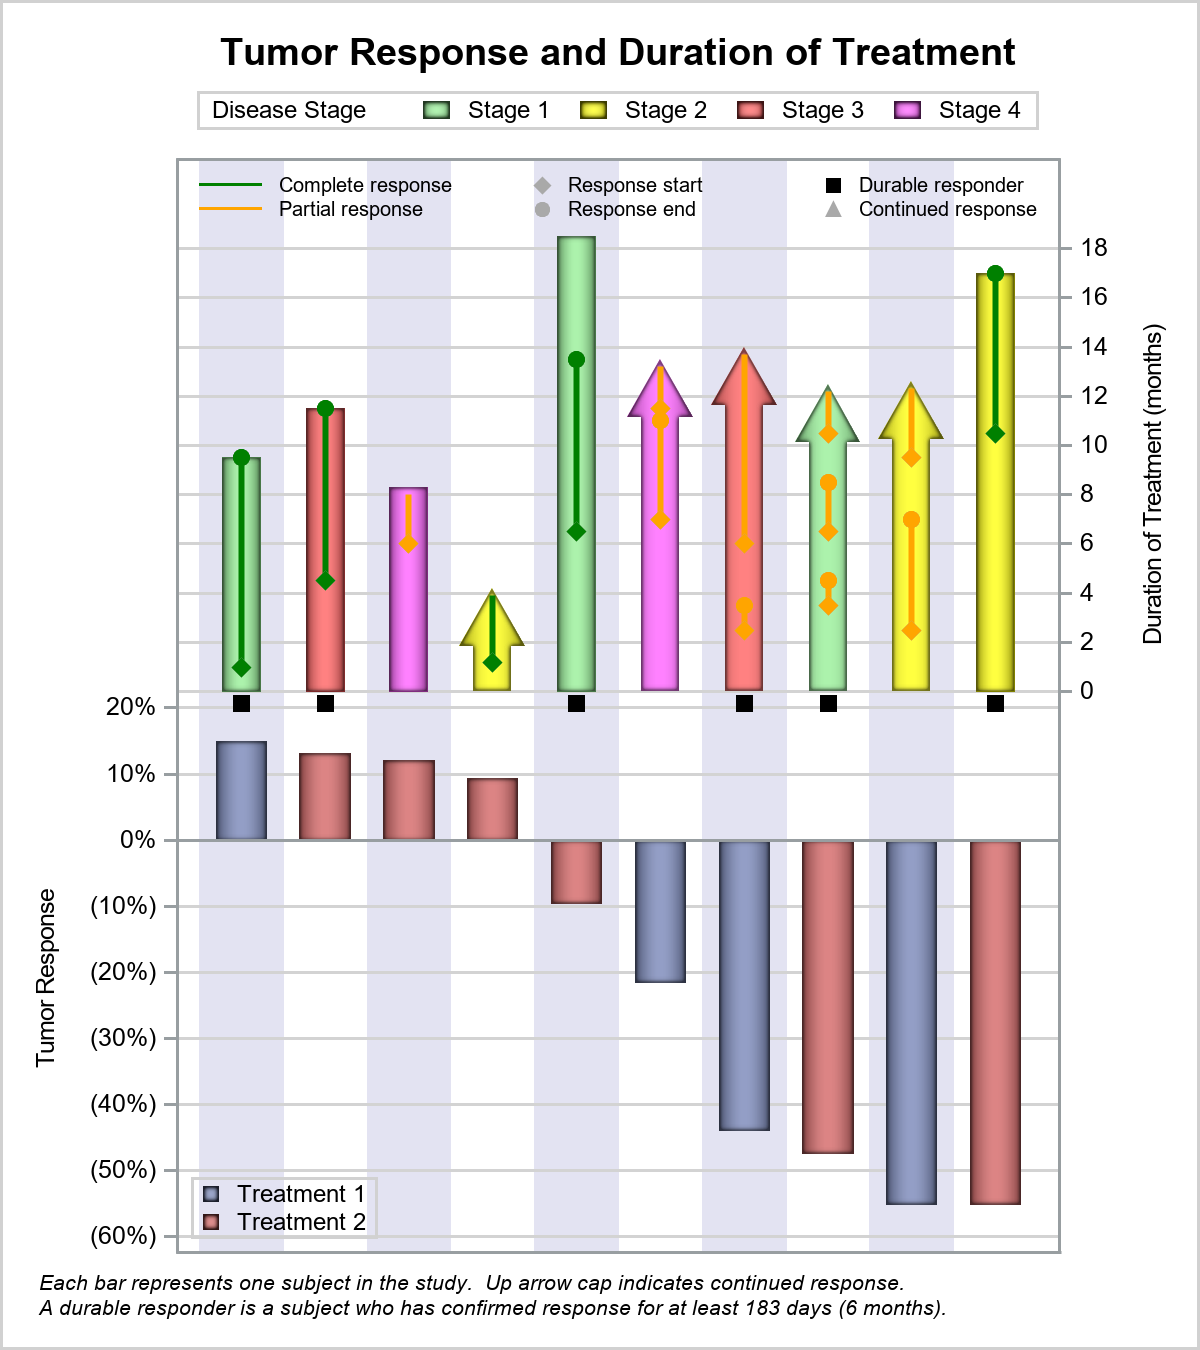
The graph has the following features:
- The lower part displays the Tumor Response sorted by increasing reduction in size by treatment.
- The upper part displays all the data from a Swimmer plot, including the duration of the treatment, Disease Stage, Response Status, duration, start and end of individual response events by status.
- Continued response and Durable responder and displayed.
- Light vertical bands are included to line up the lower and upper information.
- I will add the RECIST information on the Waterfall bars.
- The data is "made up". Real data would be helpful.
- This is created using SGPLOT procedure. This could be a good case for using GTL.
The code needs some cleanup. As I will be out to the Midwest BioStatistical Workshop in Indianapolis for the next few days, I thought I would post the current status of the graph to elicit comments from the community. I will add the RECIST information and cleanup and post the code shortly.
Clearly, the graph is not complete and more information could be added. Your comments and suggestions on how we can improve upon this are most welcome.


3 Comments
For the colors on the Disease Stage legend, since the stages are ordered, I would recommend using a color model. My personal favorite is viridis. The 4-color viridis model would use cx440154 cx30688E cx35B779 cxFEE724 (colors obtained using the macro found at https://github.com/RhoInc/sas-viridis).
Dear Sanjay, Would like to know when could you post the code for this fantastic plot?
Code posted. Sorry for the delay.